
- 首页
- 上一级
- 40亿个QQ号,限制1G内存,如何去重?.md
- 4C8G_16台和8C16G_8台,不考虑成本的情况怎么选?.md
- 4C8G的机器,各项系统指标,什么范围算是正常?.md
- InnoDB为什么不用跳表,Redis为什么不用B+树?.md
- Kafka,单分区单消费者实例,如何提高吞吐量.md
- MySQL千万级大表如何做数据清理?.md
- MySQL热点数据更新会带来哪些问题?.md
- MySQL里有2000W数据,Redis中只存20W的数据,如何保证Redis中的数据都是热点数据_.md
- Redis如果挂了,你怎么办?.md
- Redis的zset实现排行榜,实现分数相同按照时间顺序排序,怎么做?.md
- Redis的内存如果用满了,会挂吗?.md
- SpringEvent和MQ有什么区别?各自适用场景是什么?.md
- a,b的联合索引,selectbwherea=xx,无法走索引覆盖什么原因?.md
- 一个接口3000QPS,接口RT为200MS,预估需要几台机器?.md
- 一个支付单,多个渠道同时支付成功了怎么办?.md
- 一个表有用户和时间两个列,现有3个需求:根据用户查;根据日期查;根据日期和用户查;问怎么建立索引?.md
- 一个订单,在11_00超时关闭,但在11_00也支付成功了,怎么办?.md
- 一次RPC请求,客户端显示超时,但是服务端不超时,可能是什么原因?.md
- 不使用synchronized和Lock如何设计一个线程安全的单例?.md
- 不用redis分布式锁,如何防止用户重复点击?.md
- 不用大于号小于号怎么判断两个正整数大小?.md
- 为什么MySQL用B+树,MongoDB用B树?.md
- 为什么一定要做限流?不应该服务好客户吗?不应该是加机器吗?.md
- 为什么不建议使用MQ实现订单到期关闭?.md
- 为什么不用分布式锁来实现秒杀?.md
- 为什么不直接用原生的BlockinQueue做消息队列.md
- 为什么很多公司数据库不允许物理删除(delete)数据.md
- 为啥不要在事务中做外部调用?.md
- 从B+树的角度分析为什么单表2000万要考虑分表??.md
- 代码中使用长事务,会带来哪些问题?.md
- 你是如何进行SQL调优的?.md
- 你认为分布式架构一定比单体架构要好吗?.md
- 使用分布式锁时,分布式锁加在事务外面还是里面,有什么区别?.md
- 分布式系统,用户登录信息保存在服务器A上,服务器B如何获取到共享Session.md
- 分库分表时,每个城市的人口不一样,有的密集,有的稀疏,如何实现均匀分布?.md
- 加分布式锁之后影响并发了怎么办?.md
- 和其他公司做数据交互时,有什么需要注意的?.md
- 和外部机构交互如何防止被外部服务不可用而拖垮.md
- 在100M内存下存储一亿个整数,其范围在1到2亿,如何快速判断给定到一个整数值是否存在?.md
- 外卖系统,一天一千万条数据,用户需要查到近30天的数据,商家也要查询到30天的数据,怎么设计表?.md
- 大型电商的订单系统,如何设计分库分表方案?.md
- 大量的手机号码被标记成骚扰电话,如何存储这些号码_.md
- 如何做SQL调优:用了主键索引反而查询很慢?.md
- 如何做平滑的数据迁移_.md
- 如何实现_查找附近的人_功能?.md
- 如何实现一个抢红包功能?.md
- 如何实现敏感词过滤?.md
- 如何实现百万级排行榜功能?.md
- 如何实现百万级数据从Excel导入到数据库?.md
- 如何实现缓存的预热?.md
- 如何用Redis实现朋友圈点赞功能?.md
- 如何解决消息重复消费、重复下单等问题?.md
- 如何设计一个购物车功能?.md
- 如何预估一个系统的QPS?.md
- 如果你的业务量突然提升100倍QPS你会怎么做?.md
- 如果单表数据量大,只能考虑分库分表吗?.md
- 如果要存IP地址,用什么数据类型比较好?.md
- 如果让你实现一个RPC框架,会考虑用哪些技术解决哪些问题?.md
- 如果让你实现消息队列,会考虑哪些问题?.md
- 如果需要跨库join,该如何实现?.md
- 实现一个登录拉黑功能,实现拉黑用户和把已经登陆用户踢下线。.md
- 库存扣减如何避免超卖和少卖?.md
- 应用占用内存持续增长,但是堆内存、元空间都没变化,可能是什么原因?.md
- 应用启动后前几分钟,Load、RT、CPU等飙高,如何定位,可能的原因是什么?.md
- 怎么做数据对账?.md
- 把商品加入购物车时断网了,该怎么在重新联网时同步?.md
- 数据库乐观锁和悲观锁以及redis分布式锁的区别和使用场景?.md
- 数据库逻辑删除后,怎么做唯一性约束?.md
- 每天100w次登录请求,4C8G机器如何做JVM调优?.md
- 消息队列使用拉模式好还是推模式好?为什么?.md
- 用了一锁二查三更新,为啥还出现了重复数据?.md
- 电商下单场景,如何设计一个数据一致性方案?.md
- 索引失效的问题是如何排查的,有那些种情况?.md
- 线上接口如果响应很慢如何去排查定位问题呢?.md
- 给第三方提供接口调用,需要注意些什么?.md
- 订单到期关闭如何实现.md
- 让你设计一个秒杀系统,你会考虑哪些问题?.md
- 让你设计一个订单号生成服务,该怎么做_.md
- 说一说多级缓存是如何应用的?.md
- 读取一千个文件,一个线程读取和开十个线程读取,哪种方式效率高?.md
- 调用第三方接口支付时,第三方接口显示支付成功,但是在调用方显示支付失败,问题可能出在哪里.md
- 进入电梯里断网后又恢复刚开始为什么网络慢?.md
- 项目中,如果日志打印成为瓶颈,该如何优化?.md
- 高并发的库存系统,在数据库扣减库存,怎么实现?.md
✅线上接口如果响应很慢如何去排查定位问题呢?
典型回答
想要定位一个接口响应慢,有一个神器必备,那就是阿里巴巴推出的arthas,很快的就能定位到接口RT慢的问题,具体有一个案例,大家可以看下:
使用Arthas定位接口慢的步骤大致如下:
1、首先就是通过各种监控系统,发现慢的现象或者问题。我们明确的知道了具体是哪个接口慢了。然后才能开始分析。
2、安装arthas,arthas就是一个命令工具,他通过字节码插桩的方式来统计接口耗时的,很多公司的生产环境也都是可以用的,包括我司的生产环境都是可以用的,目前没发现什么副作用。
curl -L http://start.alibaba-inc.com/install.sh | sh
以上命令即可安装。
3、运行,比较简单,执行命令就行:
sh as.sh
4、查看接口耗时,这个就需要借助arthas的trace命令了,详见 https://arthas.aliyun.com/ 官网,trace命令的主要作用就是查看方法内部调用路径,并输出方法路径上的每个节点上耗时。
参数说明如下:
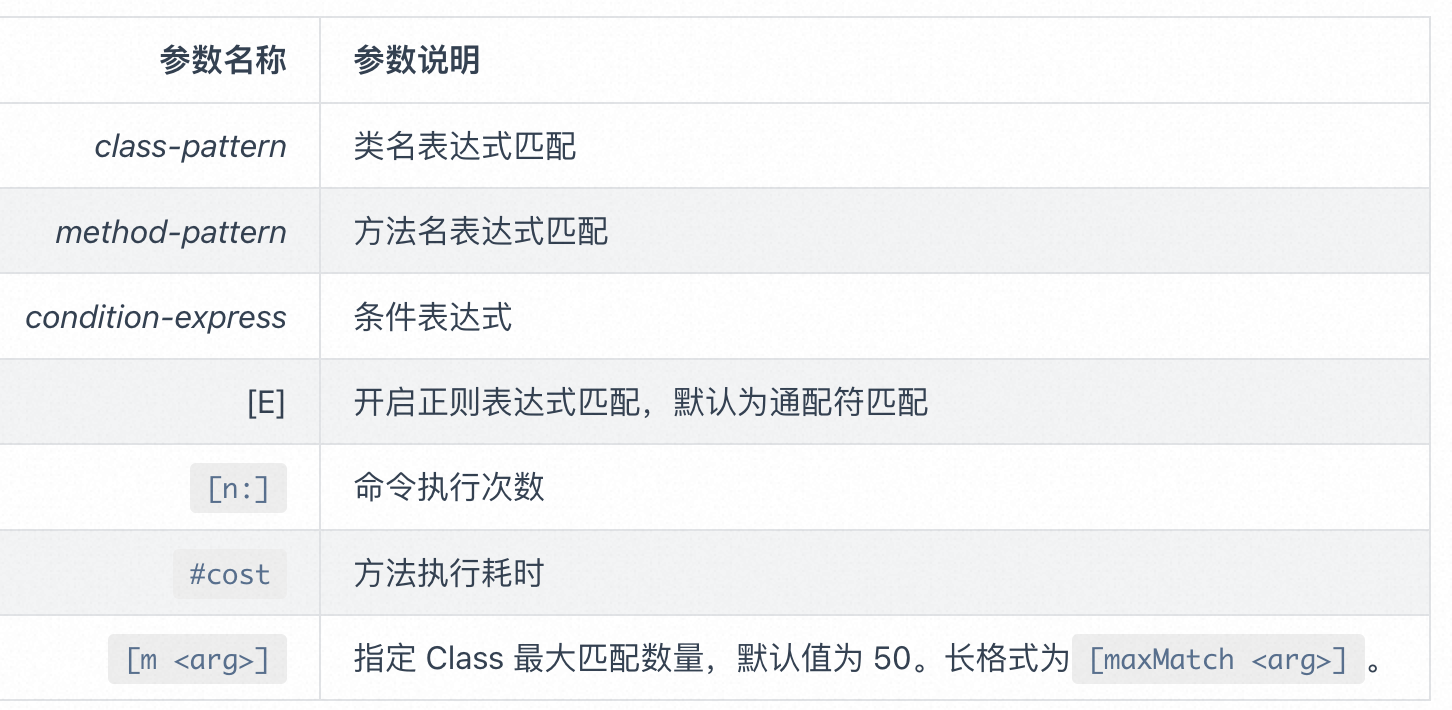
比如直接查看一次真实请求的耗时情况(例子来自官网,大家可以自己实践一下):
$ trace demo.MathGame run
Press Q or Ctrl+C to abort.
Affect(class-cnt:1 , method-cnt:1) cost in 28 ms.
`---ts=2019-12-04 00:45:08;thread_name=main;id=1;is_daemon=false;priority=5;TCCL=sun.misc.Launcher$AppClassLoader@3d4eac69
    `---[0.617465ms] demo.MathGame:run()
        `---[0.078946ms] demo.MathGame:primeFactors() #24 [throws Exception]

`---ts=2019-12-04 00:45:09;thread_name=main;id=1;is_daemon=false;priority=5;TCCL=sun.misc.Launcher$AppClassLoader@3d4eac69
    `---[1.276874ms] demo.MathGame:run()
        `---[0.03752ms] demo.MathGame:primeFactors() #24 [throws Exception]
如果方法调用的次数很多,那么可以用-n参数指定捕捉结果的次数。比如下面的例子里,捕捉到一次调用就退出命令:
$ trace demo.MathGame run -n 1
Press Q or Ctrl+C to abort.
Affect(class-cnt:1 , method-cnt:1) cost in 20 ms.
`---ts=2019-12-04 00:45:53;thread_name=main;id=1;is_daemon=false;priority=5;TCCL=sun.misc.Launcher$AppClassLoader@3d4eac69
    `---[0.549379ms] demo.MathGame:run()
        +---[0.059839ms] demo.MathGame:primeFactors() #24
        `---[0.232887ms] demo.MathGame:print() #25

Command execution times exceed limit: 1, so command will exit. You can set it with -n option.
也可以做一些过滤,比如耗时超过一定时长的再进行观测:
$ trace demo.MathGame run '#cost > 1000'
Press Ctrl+C to abort.
Affect(class-cnt:1 , method-cnt:1) cost in 41 ms.
`---ts=2018-12-04 01:12:02;thread_name=main;id=1;is_daemon=false;priority=5;TCCL=sun.misc.Launcher$AppClassLoader@3d4eac69
    `---[12.033735ms] demo.MathGame:run()
        +---[0.006783ms] java.util.Random:nextInt()
        +---[11.852594ms] demo.MathGame:primeFactors()
        `---[0.05447ms] demo.MathGame:print()
以上就是只观测耗时超过1000Ms的请求。
5、分析耗时。
如下面一个trace的输出信息,可以看到,一个接口整体耗时在265ms左右,但是其中有221ms是耗时在com.alibaba.fin.pricing.*.ExercisePriceDomainService:queryMatchedEffectiveExercisePrice() #167 这里的,所以就可以直接去看代码,分析下这里为什么有耗时了。
[arthas@1658]$ trace com.alibaba.fin.pricing.**.PriceCalculateService trial '#cost > 50' -n 3
Press Q or Ctrl+C to abort.
Affect(class count: 1 , method count: 1) cost in 427 ms, listenerId: 6
`---ts=2021-11-08 15:10:24;thread_name=HSFBizProcessor-DEFAULT-8-thread-224;id=2d7c1;is_daemon=true;priority=10;TCCL=com.taobao.pandora.boot.loader.LaunchedURLClassLoader@783e6358;trace_id=2132e43116363554229592404e58b8;rpc_id=9.40.6
    `---[264.85838ms] com.alibaba.fin.pricing.**.service.PriceCalculateService:trial()
        +---[0.012009ms] com.alibaba.fin.pricing.**.request.PriceCalculateRequest:getTenant() #95
        +---[0.001564ms] com.alibaba.fin.pricing.**.request.PriceCalculateRequest:getProduct() #96
        ...
        ...
        ...
        +---[221.884809ms] com.alibaba.fin.pricing.*.ExercisePriceDomainService:queryMatchedEffectiveExercisePrice() #167
        +---[0.002242ms] com.alibaba.fin.pricing.**.service.PriceQueryRequest:<init>() #170
        `---[0.012586ms] com.alibaba.fin.pricing.**.service.PriceCalculateService:getTieredPrice() #170
6、耗时优化,在定位到具体耗时的代码时,就可以分析了,是请求执行慢了,还是SQL慢了,还是哪里慢了,然后就想办法优化:
https://www.yuque.com/hollis666/xkm7k3/ifuuagaqo3yd8vqb
https://www.yuque.com/hollis666/xkm7k3/mgpczmz7la99dkft
https://www.yuque.com/hollis666/xkm7k3/zhfa5g